Tesla Record Deliveries – Stock Price vs. Delivery Highs & Lows
July 2nd, 2019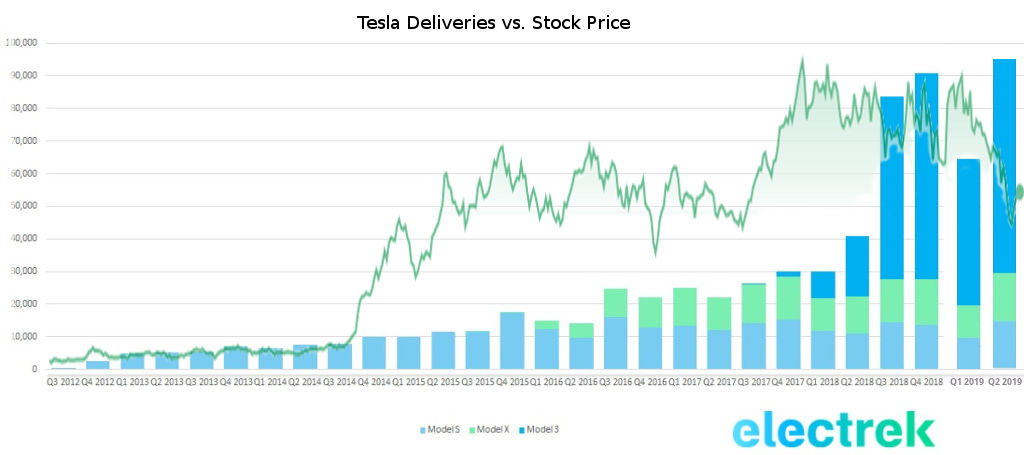
This graph illustrates level highs for both deliveries and stock price.
If you feel that vehicles delivered is an important metric, one that should impact the stock price the most, then this graph is a simple illustration of how both of these metrics correlate.
Does Tesla deserve a new high for hitting a record quarter? Or should it average out between it's high and results from last quarter?
Posted In:
ABOUT THE AUTHOR:Software Developer always striving to be better. Learn from others' mistakes, learn by doing, fail fast, maximize productivity, and really think hard about good defaults. Computer developers have the power to add an entire infinite dimension with a single Int (or maybe BigInt). The least we can do with that power is be creative.

 The Limiting Factor
 Whole Mars Catalog